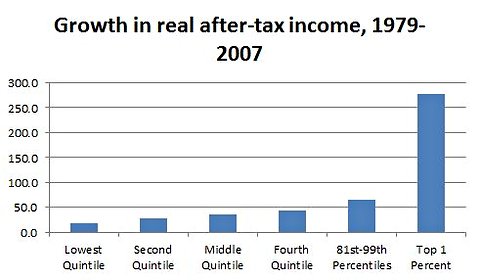
Trickle-down economics has now become shut-your-trap economi
6 posts
• Page 1 of 1
Re: Trickle-down economics has now become shut-your-trap eco
Why does the graph stop at 2007? I don't think this graph proves what you purport it to say because it ignores the housing market crash.
"My usefulness to Occupy Sacramento has pretty much come to an end."
- Red Slider (poet, activist, conspiracy theorist)
- Red Slider (poet, activist, conspiracy theorist)
- La_resistance
- Posts: 26
- Joined: Sun Oct 30, 2024 8:16 pm
Re: Trickle-down economics has now become shut-your-trap eco
The figure comes from a Congressional Budget Office report entitled
"Trends in the Distribution of Household Income Between 1979 and 2007", Pub. No. 4031, October 2011.
The label on the vertical axis is Percent
"Trends in the Distribution of Household Income Between 1979 and 2007", Pub. No. 4031, October 2011.
The label on the vertical axis is Percent
- Freakindj
- Posts: 10
- Joined: Mon Jan 02, 2024 6:11 am
Re: Trickle-down economics has now become shut-your-trap eco
The figures come from the Congressional Budget Office. The graph, however, was generated by someone.
My questions are: Why did the graph maker, manipulating the data, choose to specifically exclude the last 5 years -- that includes the recent economic downturn? What would the graph look like if it contained the complete data? What agenda are they pushing?
My questions are: Why did the graph maker, manipulating the data, choose to specifically exclude the last 5 years -- that includes the recent economic downturn? What would the graph look like if it contained the complete data? What agenda are they pushing?
"My usefulness to Occupy Sacramento has pretty much come to an end."
- Red Slider (poet, activist, conspiracy theorist)
- Red Slider (poet, activist, conspiracy theorist)
- La_resistance
- Posts: 26
- Joined: Sun Oct 30, 2024 8:16 pm
Re: Trickle-down economics has now become shut-your-trap eco
La_resistance wrote:The figures come from the Congressional Budget Office. The graph, however, was generated by someone.
My questions are: Why did the graph maker, manipulating the data, choose to specifically exclude the last 5 years -- that includes the recent economic downturn? What would the graph look like if it contained the complete data? What agenda are they pushing?
Well it would certainly look a lot worse but the fiqures would be disputed because it would not have come from an official source.
- Freakindj
- Posts: 10
- Joined: Mon Jan 02, 2024 6:11 am
Re: Trickle-down economics has now become shut-your-trap eco
I would bet that you're wrong. Historically, economic downturns have a way of lowering the gap between the rich and the poor.
"My usefulness to Occupy Sacramento has pretty much come to an end."
- Red Slider (poet, activist, conspiracy theorist)
- Red Slider (poet, activist, conspiracy theorist)
- La_resistance
- Posts: 26
- Joined: Sun Oct 30, 2024 8:16 pm
6 posts
• Page 1 of 1
Return to Political and Social Issues
Who is online
Users browsing this forum: No registered users and 1 guest
